FINANCE × DATA × DESIGN

I turn complex finance
into clear decisions.

A selection of enterprise Power BI solutions designed for FP&A, programme performance, procurement and receivables.

Explore the work

THE PRACTICE

Not just dashboards.
Decision systems.

Each solution connects business logic, data modelling, governance and interaction design, so people can move from a question to a trusted answer.

  • Power Query & data integration
  • Data modelling & DAX
  • Data quality, security & governance
  • UX, navigation & storytelling
  • Documentation, training & user adoption

SELECTED WORK

4 CASE STUDIES
01
FP&A

Budget monitoring, made navigable

A live view of actuals, budget, forecast, commitments and year-to-go, designed for budget owners and finance partners.

02
PROGRAMME PERFORMANCE

P&L intelligence across programmes

Margins, revenue, costs, break-even and operational ratios brought together in one decision-focused experience.

03
PROCUREMENT

From purchase request to payment

A connected view from purchase request to invoice, through purchase orders and receipts, for procurement teams and budget owners.

04
RECEIVABLES

Collections and ageing, without the manual work

A controlled view of overdue balances, ageing trends, DSO, receipts and doubtful debt provisions.

01

FP&A FINANCIAL REPORT

BACK TO INDEX ↑
THE CHALLENGE

Teams needed one consolidated, automated and trusted view across actuals, budget, forecast and open commitments, with enough detail to act before year-end.

AUDIENCE

Heads of Departments, Budget owners, FP&A Business Partners

REPORT SLIDES

Use the arrows or thumbnails to explore this report.

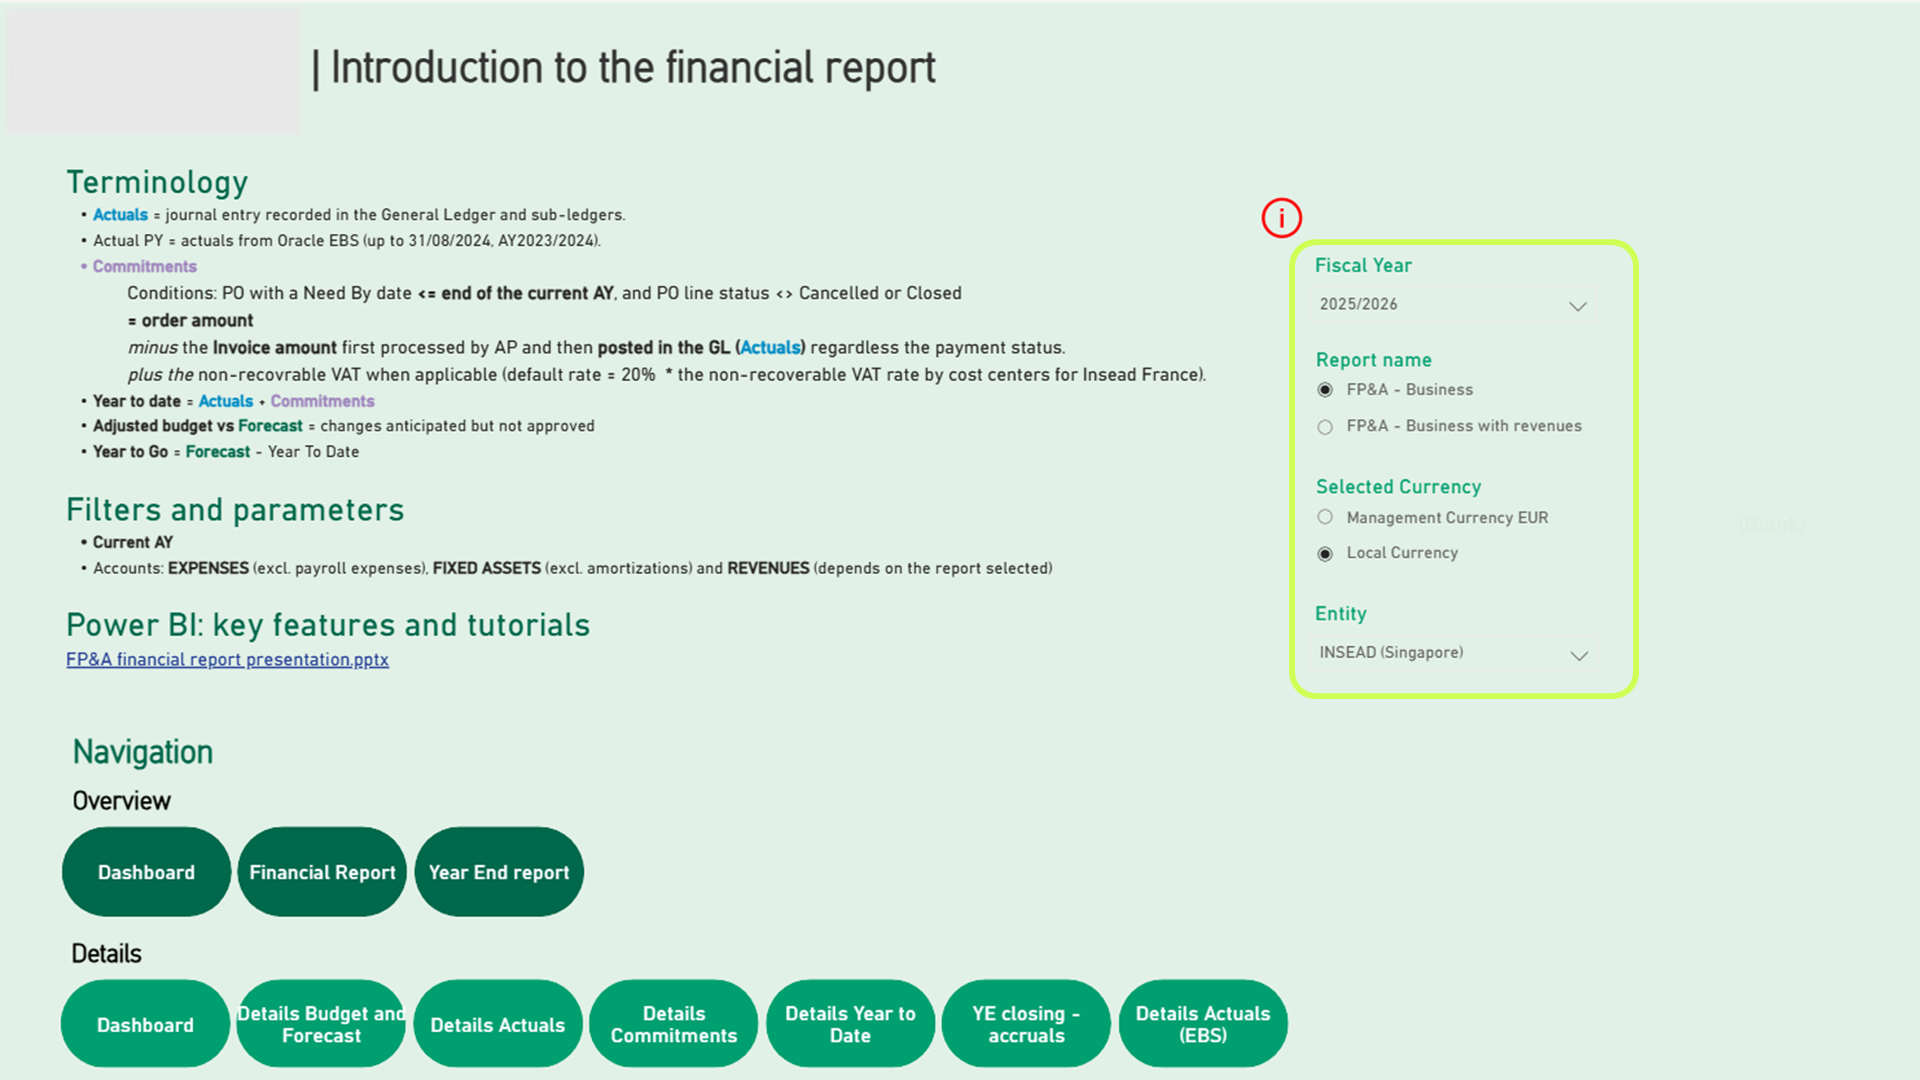
FP&A FINANCIAL REPORTReport guide

Definitions, parameters and navigation across planning and actuals

ANONYMISED VIEW
FP&A Financial Report, slide 1 sur 9
FP&A Financial Report01 / 09
MY RESPONSE

I designed a guided reporting experience around two decision metrics: year-to-date combines actuals and open commitments; year-to-go shows what remains against forecast. Users move from an overview to account, cost-centre and transaction detail while retaining the same reporting scope.

KEY CAPABILITIES
  • Year-to-date & year-to-go logic
  • Line-level budget overrun flags
  • Reporting and local currency views with dynamic formatting
  • Accrual calculations and closing actions
  • Centralised account-scope controls
  • Overview-to-detail navigation
A clearer, repeatable route from budget position to the underlying action.
02

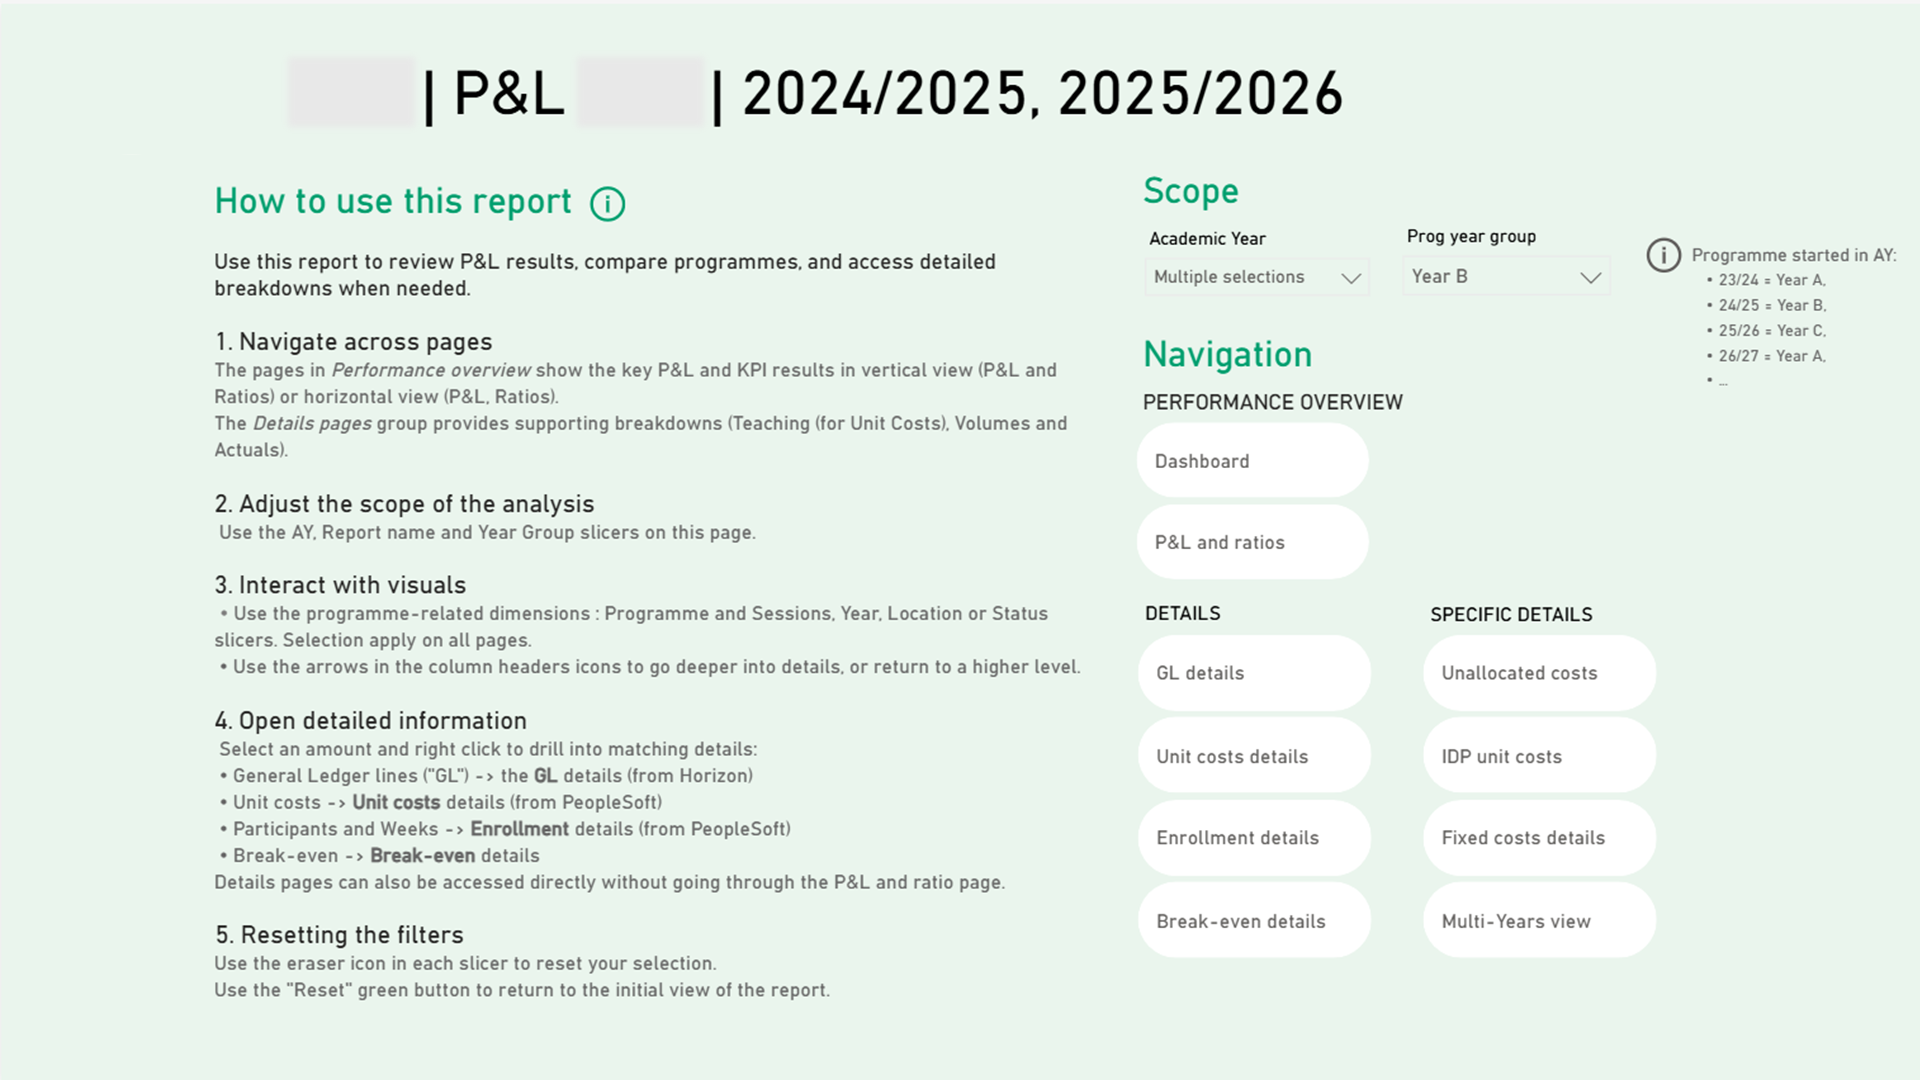
P&L BY PROGRAMME

BACK TO INDEX ↑
THE CHALLENGE

Programme performance depended on financial and operational data living at different grains, with complex allocation and mapping rules.

AUDIENCE

Programme management, FP&A Business Partners

REPORT SLIDES

Use the arrows or thumbnails to explore this report.

REPORT GUIDEReport guide

Navigation, analytical scope and reusable allocation framework

ANONYMISED VIEW
P&L by Programme, slide 1 sur 11
P&L by Programme01 / 11
MY RESPONSE

I designed a consolidated semantic model for revenue, costs, margins, volumes and break-even analysis. Within the same programme family, each P&L line can use its own data source and filter context. Mapping-driven rules also let different programme families apply their own allocation logic without changing the shared model or report. Users move from the performance overview to supporting GL, teaching-cost and enrolment details.

KEY CAPABILITIES
  • Reusable multi-level P&L hierarchy
  • Line-specific data sources and filter context
  • Mapping-driven allocations by programme model
  • Shared semantic model across programme families
  • Drill-through to GL, teaching-cost and enrolment evidence
A scalable reporting framework: new programme perspectives and allocation rules can be introduced without rebuilding the model or report.
03

PURCHASE TO PAY

BACK TO INDEX ↑
THE CHALLENGE

Teams needed visibility across the whole purchasing journey, while preserving the different levels of detail at each process step.

AUDIENCE

Procurement teams, budget owners, FP&A Business Partners

REPORT SLIDES

Use the arrows or thumbnails to explore this report.

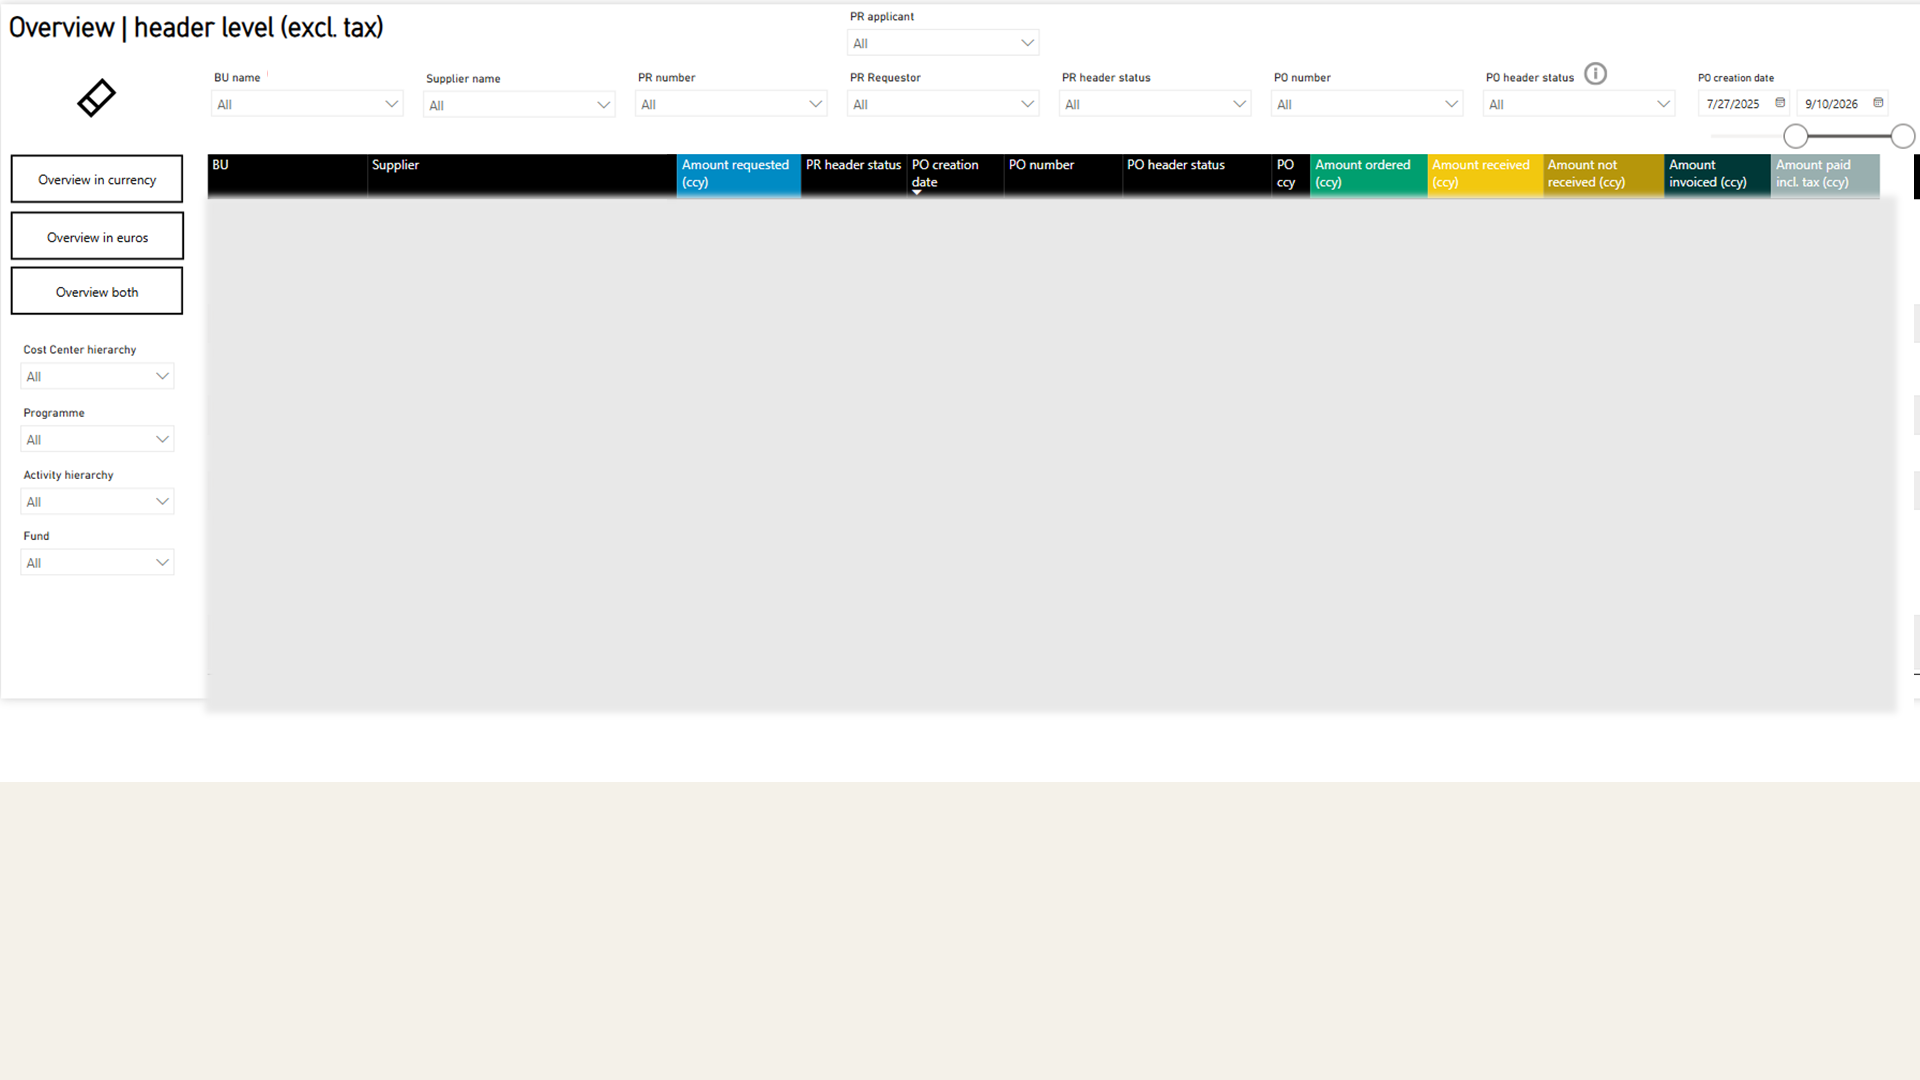
PURCHASE TO PAYProcess overview

Follow activity from purchase request to invoice, through purchase orders and receipts

ANONYMISED VIEW
Purchase to Pay, slide 1 sur 5
Purchase to Pay01 / 05
MY RESPONSE

I connected the purchasing journey in one analytical experience. A high-level view compares requested, ordered, received, outstanding and invoiced amounts; users can then move into request, order, receipt, invoice and payment detail, in transaction currency or euros.

KEY CAPABILITIES
  • PR, PO, receipt, invoice & payment detail
  • Header-to-line exploration
  • Transaction and reporting currencies
  • Commitment, status & VAT logic
Faster investigation of purchasing activity and fewer disconnected manual extracts.
04

ACCOUNTS RECEIVABLES

BACK TO INDEX ↑
THE CHALLENGE

Ageing and collection reporting relied on recurring manual preparation, with historical and current positions difficult to compare consistently.

AUDIENCE

Chief Financial Officer, receivables teams

REPORT SLIDES

Use the arrows or thumbnails to explore this report.

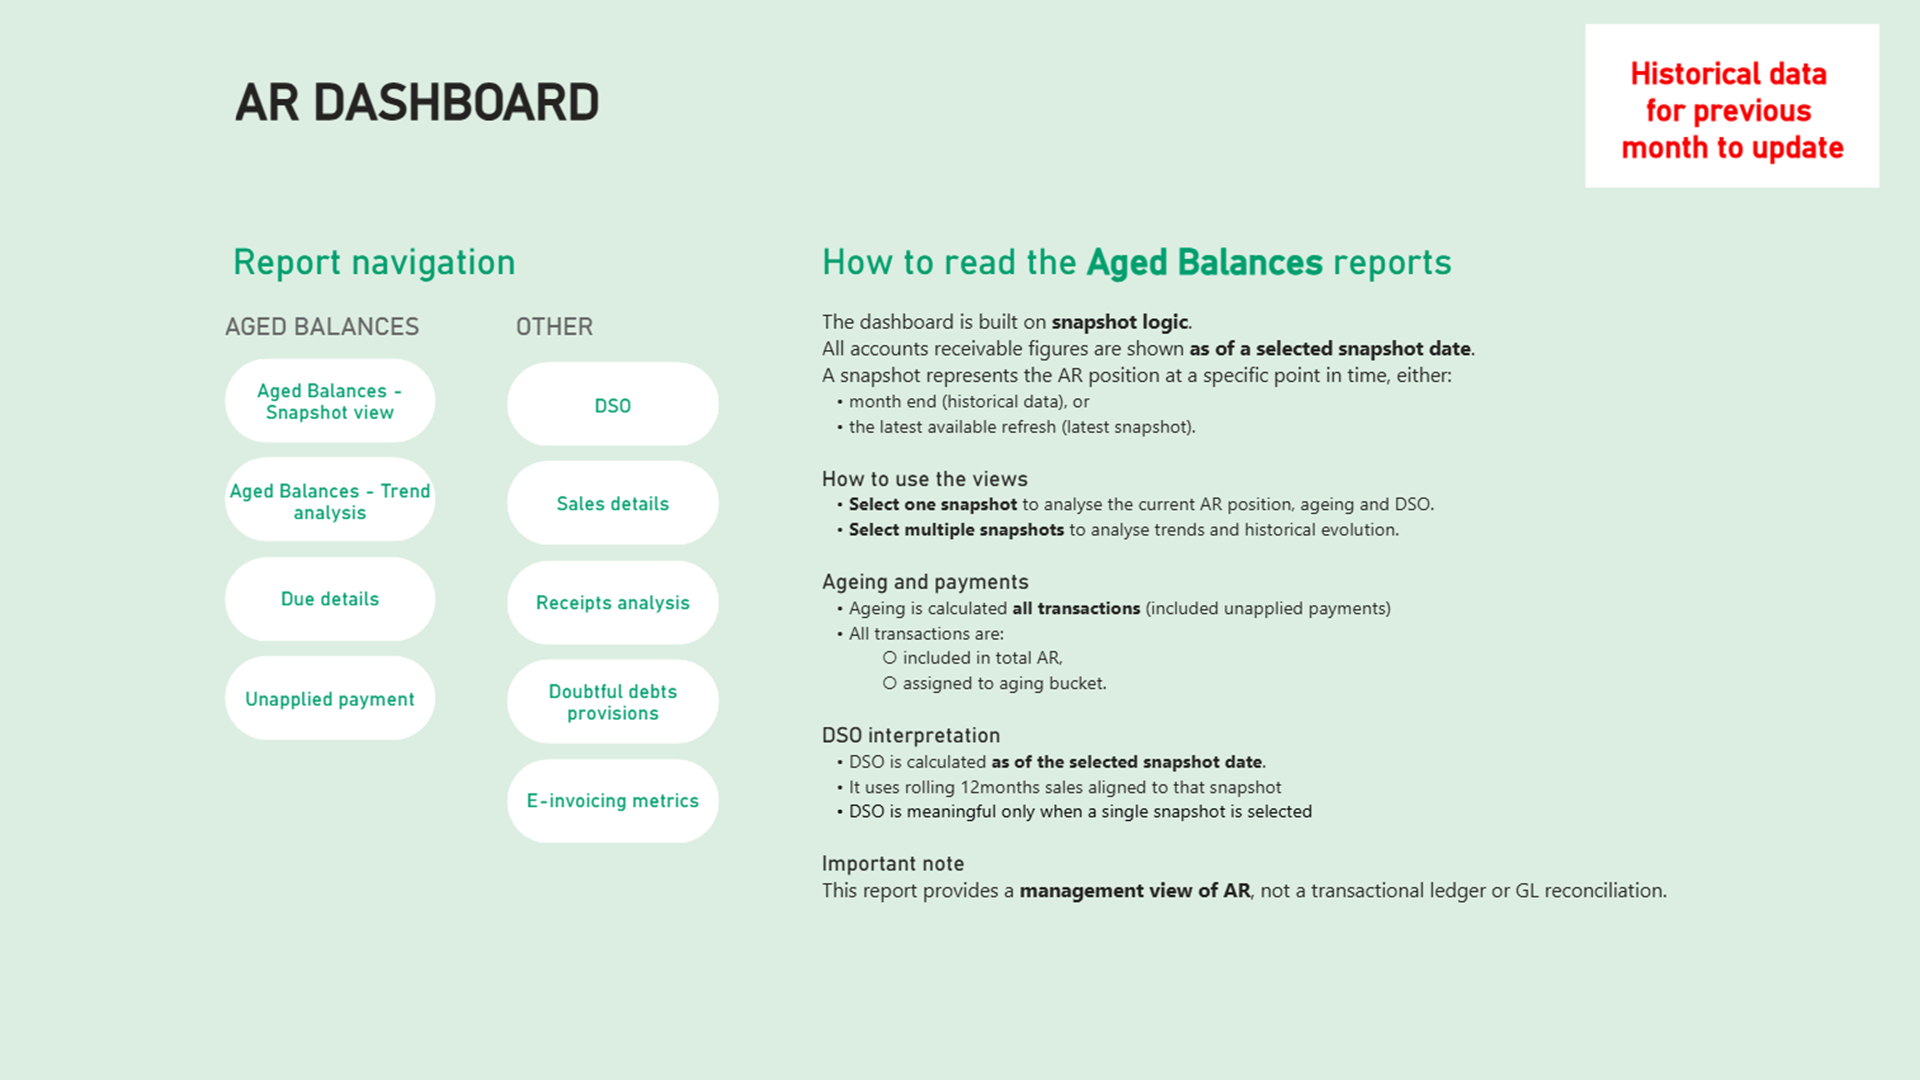
ACCOUNTS RECEIVABLESReport guide

Navigation, scope and interpretation of receivables analysis

ANONYMISED VIEW
Accounts Receivables, slide 1 sur 8
Accounts Receivables01 / 08
MY RESPONSE

I designed a snapshot-based management dashboard: one snapshot explains the current AR position, ageing and DSO; multiple snapshots reveal trends over time.

KEY CAPABILITIES
  • Current position and historical evolution
  • Ageing and overdue exposure
  • Sales, DSO & collection performance
  • Automated doubtful-debt provisions
  • Visible data-quality controls
A controlled path toward automated receivables monitoring, clearly positioned as a management view rather than a transactional ledger.

DESIGN PRINCIPLES

Trust is a feature.

Every portfolio visual is anonymised. Employer data, internal identities, access rules, URLs and proprietary implementation details are deliberately excluded.

LET’S CONNECT
Interested in finance transformation, Power BI or data-driven decision support?

Connect on LinkedIn